Recently developed adhesion atomic force microscopy was used as a technique to map the spatial arrangement of chemical functional groups at a surface with a lateral resolution of 20 nm. The ratio of the adhesion forces for different functional groups can be compared with the values determined from the known surface energies. This concept was demonstrated by mapping the adhesive interaction of domains in a phase-separated lipid monolayer with the AFM tip. The ratio of the adhesion forces for both phases corresponds with the theoretical number for the CH2 and CH3 groups.
The spatial arrangement of functional groups and their interactions are important in fields as diverse as biophysics: recognition in biological systems or immunosensors; engineering: lubrication in mechanical devices; molecular electronics: adhesion between polymers and metals; and chemistry: chemical modifications of polymer surfaces. For an improved understanding of these problems it is important to be able to study the arrangement of chemical functional groups and their interactions at the molecular level.
Direct measurements of forces between molecular assemblies have been performed with the surface forces apparatus (SFA)1-4 between crossed cylinders (radius of curvature: R ~ 1 cm). For molecular force measurements on a laterally smaller scale atomic force microscopic (AFM)5 methods have been used. To obtain a well-defined probe geometry, spherical probes have been attached to AFM cantilevers (R ~ 10-100 \(\mu\)m). In these experiments forces between single complementary strands of DNA6 and discrete intermolecular interactions of ligand-receptor pairs7 have been studied. The adhesion forces between individual ligand-receptor pairs have also been measured with chemically modified AFM tips (R ~ 100 nm).8
It has been pointed out before that it should be possible to use the AFM to characterize the surface chemical composition as well as the topography.9,10 Burnham et al.9 found that the adhesive forces between tip and sample increased systematically with surface energy. To image material properties as well as topography on thin films adhesive interactions,10-12 elastic properties,13,14 and friction forces13,15-18 have been mapped. Using the friction force, a discrimination between hydrophilic and hydrophobic groups that were covalently bound to sample and probe has been achieved with a lateral resolution of 200 nm.16
Instead of hypothesizing the relation between adhesion and friction at the molecular scale (for a study see Ref. 2), we chose to measure the adhesion force directly with a modified AFM.19 The ratio of the adhesion forces for different functional groups can be predicted quantitatively from their surface energies and can be compared with the experimental value. Additional advantages of this approach are that the sample is not likely to be disturbed because the probe is not scanned laterally while in contact and even very small differences in surface energy are resolved. We will demonstrate this by imaging a phase-separated lipid monolayer nondestructively.
In conventional contact-mode AFM operation, the deflection of a cantilever-probe combination is measured while scanning in contact with the sample. Therefore, the topography is imaged, while the chemical nature of the functional groups at the surface remains unknown. In adhesion AFM,12,19-21 a different approach is used. Force versus cantilever-displacement curves,19,22 show the cantilever deflection as the tip-cantilever combination approaches the sample, makes contact, and is retracted again (Figure 6.1). The hysteresis in this curve is a measure for the adhesive probe-sample interaction and is related to the chemical nature of the functional groups at the sample and probe surface. With our setup (a modified stand-alone AFM23) we can measure and analyze up to 550 force-distance curves per second, which allows direct adhesion force imaging. Other methods to measure surface forces include force curves with force feedback24 and the resonance method.10,25
Fig. 6.1 A typical force-distance curve measured with the adhesion AFM setup.19 The Si3N4 tip is moved in and out of contact by ramping a small piezo actuator. Moving the tip down, the cantilever will deflect after touching the sample (a) until a certain preset deflection is reached (b). The piezo movement up to this setpoint is a measure of the thickness of the sample because on the thicker parts of the sample this point will be reached earlier than on the thinner parts. After the setpoint has been reached, the tip is retracted to the upper limit determined by the ramping voltage. The hysteresis in the force curve results in the well-known adhesion dip. The pull-off force can be obtained when during the retrace the tip leaves the sample at some point (c). This determination is realized in hardware, allowing up to 550 force curves to be measured per second.
To demonstrate the concept, a dimyristoylphosphatidylethanolamine (DMPE) film was made by the Langmuir-Blodgett (LB) technique, at a surface pressure for which the film is in a liquid-expanded (LE) to liquid-condensed (LC) phase-transition.26 It has been demonstrated numerous times that such a film, whether at the water-air interface or deposited on a solid substrate exhibits a domain structure corresponding to the coexisting LE and LC phases.26 The DMPE molecule consists of a hydrophilic part that adheres to a hydrophilic substrate and two hydrophobic hydrocarbon chains. In the solid LC domains the layer is crystalline27 and the probe tip will only interact with the hydrophobic CH3 endgroup. In the amorphous LE phase, the molecules are less densely packed and thus a hydrophilic Si3N4 tip will have a stronger interaction with the 12 slightly less hydrophobic CH2 groups along the hydrocarbon chain. Therefore, we expect the adhesion contrast to be caused by the CH2 and CH3 groups for the LE and LC phases, respectively. However, we want to stress that it should be possible to apply the same concept to other problems.
The adhesion force is connected with interfacial energy, which is a concept that can be applied to macroscopic as well as microscopic systems.1 Macroscopically, the interfacial energy can be determined by contact angle measurements. For microscopic systems, and even for very small numbers of molecules, its numerical value is close to that of a planar macroscopic surface composed of the same molecules.28
To compare absolute adhesion forces with theory a very well-defined probe geometry is needed. This can be obtained by the attachment of spherical probes to an AFM cantilever. However, because of their size these probes are not suitable for high-resolution imaging, and therefore we chose a different approach. The relative humidity and the geometry of a normal AFM tip remain the same for the different areas within one image and within the measuring time (typically 10 min). Therefore, we focus on the ratio of the adhesion forces for the respective domains, a number that can easily be derived from basic thermodynamics.1
Our central result is that a simple thermodynamic model can be used to predict the ratio of the adhesion forces for different functional groups. The adhesion force can be written as
\[F\propto RW_{132}\tag{6.1}\]
where R is the radius of curvature of the end of the Si3N4 tip and W132 is the energy change on separating unit area of two media 1 and 2 in medium 3.
\[W_{132}=\gamma_{13}+\gamma_{23}-\gamma_{12}\tag{6.2}\]
where \(\gamma_{ab}\) is the interfacial energy of media a and b. In our case we have medium 1, DMPE (sample); medium 2, Si3N4 (tip); medium 3, air. Therefore, we can estimate \(\gamma_{13}=\gamma_1\); \(\gamma_{23}=\gamma_2\); and \(\gamma_{12}=\gamma_1 +\gamma_2 -2\sqrt{\gamma_1\gamma_2}\) using the combining relations.1 Thus,
\[F\propto R\sqrt{\gamma_1\gamma_2}\tag{6.3}\]
as has been found previously.3,9 Note that for the Johnson, Kendall, and Roberts (JKR)29 theory as well as for the Derjaguin, Muller, and Toporov (DMT)30 theory the adhesion force increases linearly with R and the interfacial energy, with proportionality constants of \(3\pi\) and \(4\pi\), respectively.
DMPE Langmuir-Blodgett monolayers were prepared on different substrates to enable the use of adhesion AFM as well as optical surface plasmon microscopy.31 Substrates for surface plasmon microscopy were made by evaporation of 45 nm gold (1 nm/s at 10-6 mbar) on top of a microscope cover slip. After the evaporation, 3 nm SiO2 was sputtered on top of the gold (0.1 nm/s at 10-2 mbar of Ar) to make the substrate hydrophilic. Atomically smooth mica substrates were freshly cleaved and used for adhesion AFM measurements.
LB films were obtained by spreading a 1 mg/mL solution of the lipid DMPE (obtained from Sigma, used without further purification) in 3:1 (v/v) chloroform/methanol onto the subphase (water from Millipore system, resistivity > 18.2 M\(\Omega\)/cm, pH adjusted to 7.5). The monolayer was transferred to the substrate at a surface pressure of 12 mN/m and a molecular area of 0.50 nm2. Compression speed, 0.01 nm2/min per molecule; dipping speed, 3 mm/min; transfer ratio ~1. A commercial LB trough was used (KSV 5000; KSV Instruments Ltd., Helsinki, Finland) in a laminar flow cabinet.
Both the surface plasmon microscope32 and AFM19,23 are home-built and were described earlier. The topography and the peak value of the adhesion dip as well as its width and area are determined on-line from the force-distance curves by electronic hardware. A ramp generator coupled to the piezo actuator moving the tip up and down is triggered by a pixel clock. When a certain preset deflection is reached, the piezo voltage is stored in a sample/hold circuit (the topography signal) and the ramping voltage is reversed. A peak detector is used to measure the peak of the adhesion dip (the pull-off force) during the retrace. This procedure is repeated for every pixel in the image.
The cantilevers have a pyramidal Si3N4 tip attached to a V-shaped beam with a force constant of 0.58 N/m. The tips were ozone cleaned before use. For experiments with a controlled relative humidity the AFM setup with the sample was put in a plexiglass chamber purged with nitrogen gas of known humidity. By mixing streams of wet (obtained by bubbling the gas through distilled water) and dry nitrogen gas at an appropriate flow ratio the desired relative humidity was obtained and measured by a digital hygrometer.
Fig. 6.2 Surface plasmon microscopy image, and (b) adhesion AFM image of the same DMPE domains. The surface plasmon microscope used was described earlier.32 In the optical image, dark regions correspond to thicker (LC) domains, in the adhesion AFM image these regions have lower adhesion forces. Quantitative surface plasmon microscopy measurements of the layer thickness were performed by defining a number of small areas in the microscopic image for which the reflectance is measured automatically as a function of the angle of incidence.32 By determining the shift of the surface plasmon resonance minima the layer thicknesses for the different areas were determined using Fresnel theory.
Apart from providing an illustration of the method used, Figure 6.1 displays a typical result for a force curve on a DMPE monolayer. From the figure we can conclude that any possible deformation of the sample is reversible because little hysteresis is observed in the loading part of the curve. A finite elastic deformation, however, has no effect on the adhesion force according to JKR theory.29 The reproducibility that was observed (data not shown) also points to the non-destructiveness of the method. This is in accordance with earlier experimental work that has shown that both the crystalline and amorphous states of DMPE form hard, fairly rigid structures.3
Before and after adhesion imaging, a phase-separated DMPE monolayer was imaged with optical surface plasmon microscopy.31,32 In the optical image in Figure 6.2(a), the familiar pattern33 for a phase-separated monolayer is observed, where the dark patches correspond to the LC regions. The contrast corresponds to a difference in optical thickness of ~0.4 nm, determined from a difference in surface plasmon resonance angle of 0.06°. This value is not uncommon for these systems,34 with the crystalline domains thicker than the amorphous domains. Comparing Figure 6.2(b), the adhesion AFM result of the same region, with Figure 6.2(a) we observe a one-to-one correspondence between both images. This is compelling evidence that adhesion AFM detects a contrast between the LE and LC phases.35
The measured adhesion forces were typically 20-30 nN (roughly an order of magnitude smaller than for the bare SiO2 substrate), and the measured adhesion force ratio \(F_{LC}/F_{LE}\) ~ 0.8 ± 0.1 (averaged over a large number of points in both regions). With \(\gamma_{LC}\approx \gamma_{CH_3}\) = 23 mJ/m2 and \(\gamma_{LE}\approx \gamma_{CH_2}\) = 31 mJ/m2,36 we find
\[\frac{F_{LC}}{F_{LE}}=\frac{R\sqrt{\gamma_{LC}\gamma_2}}{R\sqrt{\gamma_{LE}\gamma_2}}=\sqrt{\frac{\gamma_{LC}}{\gamma_{LE}}}=0.86\tag{6.4}\]
on theoretical grounds. The correspondence between these two numbers points to the difference in hydrophobicity as the contrast mechanism in adhesion AFM.
Having demonstrated that adhesion contrast can be obtained for the different phases in the domains, we used molecularly smooth mica substrates for further adhesion AFM investigations with a higher resolution on better defined samples. First, the adhesion of a clean mica substrate was measured as a function of the relative humidity (Figure 6.3). The image at constant relative humidity was essentially featureless, while the absolute adhesion forces were always higher (80-160 nN) than those measured on monolayer-covered substrates, indicating the formation of a water film.37
Fig. 6.3 Adhesion force on mica as a function of the relative humidity. Each point in this curve represents the average of 250 pull-off force measurements. The increase of the adhesion as a function of the relative humidity indicates the formation of a water layer on the mica with increasing thickness,37 causing increasing capillary forces.
The consistently much lower adhesion forces for monolayer-covered substrates as compared to the bare substrate confirm the absence of a liquid layer on top of the monolayer. This is expected for such hydrophobic surfaces and has indeed been found previously.4,38 Moreover, the presence of large (>50 nm) pinholes can safely be excluded (see Figure 6.4). However, some variations of the adhesion forces on DMPE with the relative humidity were seen. These can be explained by the presence of water on the hydrophilic AFM tip increasing the effective radius of the tip. It is important to note that this only affects the absolute adhesion forces and not the values of the ratios.
For different mica substrates, monolayers, AFM tips, and relative humidity the average value for \(F_{LC}/F_{LE}\) was 0.84 with a variance of 0.06. This number is remarkably constant and close to the expected theoretical value of 0.86. These results suggest that the model correctly predicts the ratio of the adhesion forces for the different functional groups. Therefore, the image contrast can be interpreted as the contrast in interfacial energy associated with the imaged functional groups. A further support of this
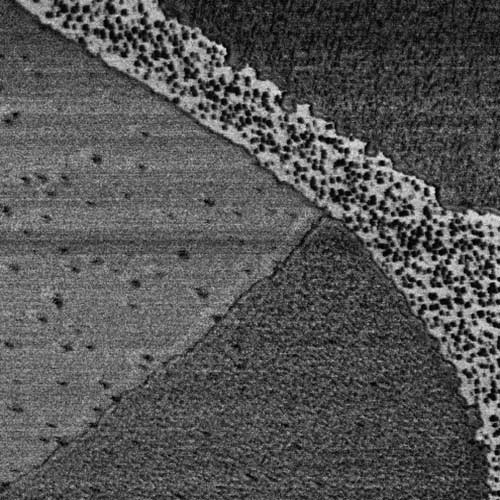
Fig. 6.4 Adhesion AFM images showing domains in the DMPE monolayer on mica. The central part was magnified for the three successive images (a-c). The left images show the adhesion, where dark areas correspond with low adhesion (LC phase). The images in the middle show the height differences, as derived from the force curves (high-pass filtered; the adhesion images were not filtered). On the right we see (a) the adhesion image for the bare mica, (b) the thickness profiles (three lines taken from an unfiltered image and shifted for clarity), and (c) the histograms for 400 adhesion measurements in the LC and LE phase. Note that for every point in these images a separate force curve was measured and analyzed (150×150 curves per image). For the topography image this means that the tip did not make a continuous profiling movement along the surface but that 0.6 nm variations in an approach of about 500 nm were measured.
view is illustrated in Figure 6.4(c), where a histogram of the measured forces for both phases is displayed. The average values for the two phases are convincingly different. Besides, we note that generally the width of such a distribution might contain valuable information on heterogeneities hitherto unnoticed.
A high lateral resolution of 20 nm (estimated from the resolution of step edges in Figure 6.4) was obtained with the monolayers on the molecularly smooth mica substrates. Simultaneously measured topography images indicated a thickness difference between the domains of 0.6 nm (Figure 6.4). The difference between the surface plasmon microscopy and AFM values can be explained by the presence of pores in the solid domains and grains in the fluid domains, which appear to have the same properties as the fluid and solid domains, respectively, and are not resolved in the optical images. This phenomenon has been observed with AFM on solid substrates before, in topography,14,39 elasticity,14 and friction measurements.17 Although these film defects have been said to be caused by the LB deposition process or interaction with the substrate,39 it is tempting to identify these 'nanodomains' with those that have been postulated earlier based on indirect observations by fluorescence microscopy40 and theoretical work.41 These nanodomains could play an important role in domain formation.
Preliminary experiments on another domain-forming lipid, DPPC, give similar results; we therefore have good confidence that the method presented here provides a general tool to image domains with different surface energies. The same method should be applicable to many other functional groups42 with a relatively low surface energy to inhibit the formation of a water film. For functional groups with relatively high surface energies measurements should be made in a liquid medium, to exclude capillary forces.
(1) Israelachvili, J. N. Intermolecular and Surface Forces, 2nd ed.; Academic Press: London, 1992.
(2) Yoshizawa, H.; Chen, Y. L.; Israelachvili, J. N. J. Phys. Chem. 1993, 97, 4128.
(3) Chen, Y. L.; Helm, C. A.; Israelachvili, J. N. J. Phys. Chem. 1991, 95, 10736.
(4) Chen, Y. L.; Gee, M. L.; Helm, C. A.; Israelachvili, J. N.; McGuiggan, P. M. J. Phys. Chem. 1989, 93, 7057.
(5) Binnig, G.; Quate, C. F.; Gerber, Ch. Phys. Rev. Lett. 1986, 56, 930. Rugar, D.; Hansma, P. K. Phys. Today 1990, 43, 23.
(6) U Lee, G.; Chrisey, L. A.; Colton, R. J. Science 1994, 266, 771.
(7) U Lee, G.; Kidwell, D. A.; Colton, R. J. Langmuir 1994, 10, 354.
(8) Florin, E.-L.; Moy, V. T.; Gaub, H. E. Science 1994, 264, 415.
(9) Burnham, N. A.; Dominguez, D. D.; Mowery, R. L.; Colton, R. J. Phys. Rev. Lett. 1990, 64, 1931.
(10) Martin, Y.; Williams, C. C.; Wickramasinghe, H. K. J. Appl. Phys. 1987, 61, 4723. Olsson, L.; Tengvall, P.; Wigren, R.; Erlandsson, R. Ultramicroscopy 1992, 42-44, 73.
(11) Torii, A.; Sasaki, M.; Hane, K.; Okuma, S. Sens. and Actuators, A 1994, 44, 153. Torii, A.; Sasaki, M.; Hane, K.; Okuma, S. Sens. and Actuators, A 1994, 40, 71.
(12) Mizes, H. A.; Loh, K. G.; Miller, R. J. D.; Ahuja, S. K.; Grabowski, E. F. Appl. Phys. Lett. 1991, 59, 2901.
(13) Overney, R. M.; Meyer, E.; Frommer, J.; Güntherodt, H.-J.; Fujihira, M.; Takano, H.; Gotoh, Y. Langmuir 1994, 10, 1281.
(14) Chi, L. F.; Anders, M.; Fuchs, H.; Johnston, R. R.; Ringsdorf, H. Science 1993, 259, 213.
(15) Overney, R. M.; Meyer, E.; Frommer, J.; Brodbeck, D.; Lüthi, R.; Howald, L.; Güntherodt, H.-J.; Fujihira, M.; Takano, H.; Gotoh, Y. Nature 1992, 359, 133. Meyer, E.; Overney, R. M.; Lüthi, R.; Brodbeck, D.; Howald, L.; Frommer, J.; Güntherodt, H.-J.; Wolter, O.; Fujihira, M.; Takano, H.; Gotoh, Y. Thin Solid Films 1992, 220, 132.
(16) Frisbie, C. D.; Rozsnyai, L. F.; Noy, A.; Wrighton, M. S.; Lieber, C. M. Science 1994, 265, 2071.
(17) Yang, X. M.; Xiao, D.; Xiao, S. J.; Wei, Y. Appl. Phys. A 1994, 59, 139.
(18) Yang, X. M.; Xiao, D.; Xiao, S. J.; Lu, Z. H.; Wei, Y. Phys. Lett. A 1994, 193, 195.
(19) van der Werf, K. O.; Putman, C. A. J.; de Grooth, B. G.; Greve, J. Appl. Phys. Lett. 1994, 65, 1195.
(20) Baselt, D. R.; Baldeschwieler, J. D. J. Appl. Phys. 1994, 76, 33.
(21) Radmacher, M.; Cleveland, J. P.; Fritz, M.; Hansma, H. G.; Hansma, P. K. Biophys. J. 1994, 66, 2159.
(22) Weisenhorn, A. L.; Hansma, P. K.; Albrecht, T. R.; Quate, C. F. Appl. Phys. Lett. 1989, 54, 2651. Blackman, G. S.; Mate, C. M.; Philpott, M. R. Phys. Rev. Lett. 1990, 65, 2270. Burnham, N. A.; Colton, R. J. J. Vac. Sci. Technol., A 1989, 7, 2906.
(23) van der Werf, K. O.; Putman, C. A. J.; de Grooth, B. G.; Segerink, F. B.; Schipper, E. H.; van Hulst, N. F.; Greve, J. Rev. Sci. Instrum. 1993, 64, 2892.
(24) Joyce, S. A.; Houston, J. E. Rev. Sci. Instrum. 1991, 62, 710.
(25) Ducker, W. A.; Cook, R. F. Appl. Phys. Lett. 1990, 56, 2408.
(26) Möhwald, H.; Kenn, R. M.; Degenhardt, D.; Kjær, K.; Als-Nielsen, J. Physica A 1990, 168, 127. For a review see Möhwald, H. Rep. Prog. Phys. 1993, 56, 653.
(27) Birdi, K. S. Lipid and Biopolymer Monolayers at Liquid Interfaces; Plenum Press: New York, 1988.
(28) Sinanoglu, O. J. Chem. Phys. 1981, 75, 463.
(29) Johnson, K. L.; Kendall, K.; Roberts, A. D. Proc. R. Soc. London, Ser. A 1971, 324, 301.
(30) Derjaguin, B. V.; Muller, V. M.; Toporov, Yu. J. Colloid Interface Sci. 1975, 53, 314.
(31) Rothenhäusler, B.; Knoll, W. Nature 1988, 332, 615.
(32) Berger, C. E. H.; Kooyman, R. P. H.; Greve, J. Rev. Sci. Instrum. 1994, 65, 2829.
(33) Flörsheimer, M.; Möhwald, H. Thin Solid Films 1990, 189, 379.
(34) Lösche, M.; Rabe, J.; Fischer, A.; Rucha, B. U.; Knoll, W.; Möhwald, H. Thin Solid Films 1984, 117, 269. Hickel, W.; Knoll, W. J. Appl. Phys. 1990, 67, 3572.
(35) Simultaneously measured topography images showed that the adhesion forces also correlated with the substrate roughness on the sub-micrometer scale, causing the modulation of the adhesion seen as a grain structure in Figure 2(b); on top of small bumps of the substrate the adhesion is lower due to a reduced contact area between tip and sample, while for holes the reverse is true.11,12,20 Due to the substrate roughness the domains were not resolved in the AFM topography signal.
(36) Zisman, W. A. Ind. Eng. Chem. 1963, 55, 19. Fowkes, F. M. Ind. Eng. Chem. 1964, 56, 40. Zisman, W. A.; Fox, J. J. Colloid Sci. 1952, 7, 428.
(37) Thundat, T.; Zheng, X-Y.; Chen, G. Y.; Sharp, S. L.; Warmack, R. J.; Schowalter, L. J. Appl. Phys. Lett. 1993, 63, 2150.
(38) Meyer, E.; Howald, L.; Overney, R. M.; Brodbeck, D.; Lüthi, R.; Haefke, H.; Frommer, J.; Güntherodt, H.-J. Ultramicroscopy 1992, 42-44, 274. Blackman, G. S.; Mate, C. M.; Philpott, M. R. Vacuum 1990, 41, 1283. Alley, R. L.; Komvopoulos, K.; Howe, R. T. J. Appl. Phys. 1994, 76, 5731.
(39) Mikrut, J. M.; Dutta, P.; Ketterson, J. B.; MacDonald, R. C. Phys. Rev. B 1993, 48, 14479. Viswanathan, R.; Schwartz, D. K.; Garnaes, J.; Zasadzinski, J. A. N. Langmuir 1992, 8, 1603.
(40) Flörsheimer, M.; Möhwald, H. Thin Solid Films 1988, 159, 115.
(41) Israelachvili, J. N. Langmuir 1994, 10, 3774.
(42) A graphic representation of the surface energy spectrum of functional groups can be found in Adamson, A. W. Physical Chemistry of Surfaces; Wiley: New York, 1967.